Here’s a detailed state-by-state breakdown of homicide statistics in the U.S. from 1965 to 2023, including total homicides, clearance rates, and estimated unsolved cases, as reported by Project: Cold Case:
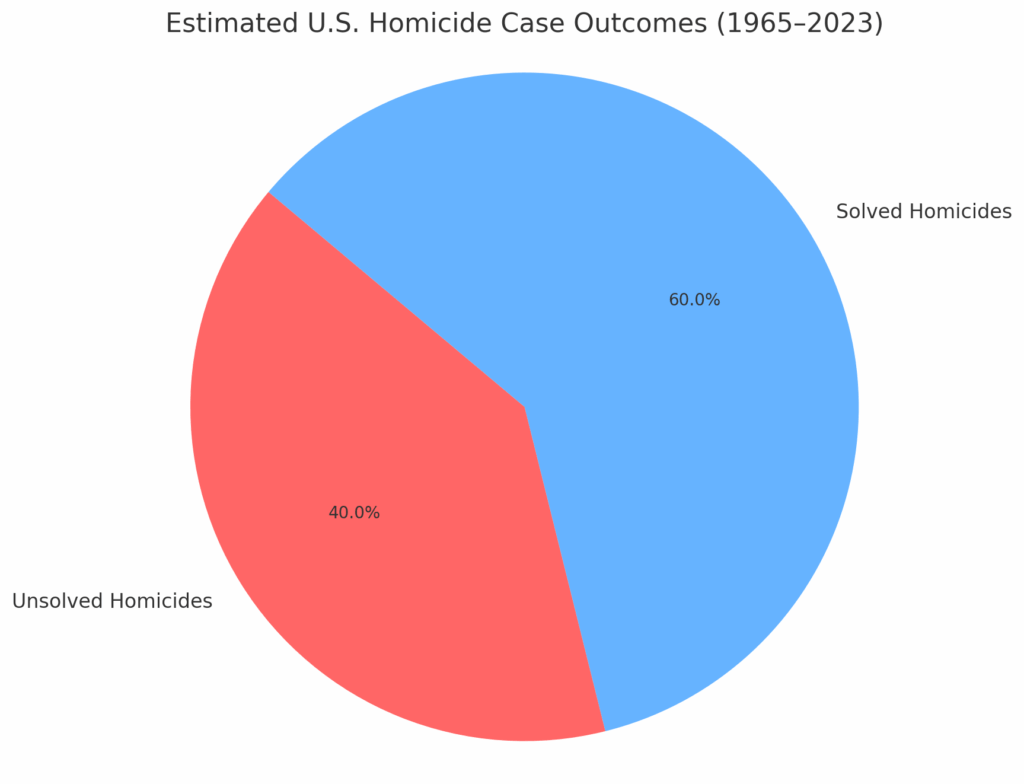
Here’s a pie chart illustrating the estimated distribution of solved versus unsolved homicide cases in the U.S. from 1965 to 2023. The estimate assumes a 60% clearance rate based on FBI data trends.
Here’s a detailed state-by-state breakdown of homicide statistics in the U.S. from 1965 to 2023, including total homicides, clearance rates, and estimated unsolved cases, as reported by Project: Cold Case.
This data highlights significant variations in homicide clearance rates across states. For instance, states like Nebraska and Wyoming have high clearance rates (82% and 84%, respectively), indicating a higher proportion of solved cases. Conversely, states such as Illinois and Michigan have lower clearance rates (54%), suggesting a larger number of unsolved homicides.
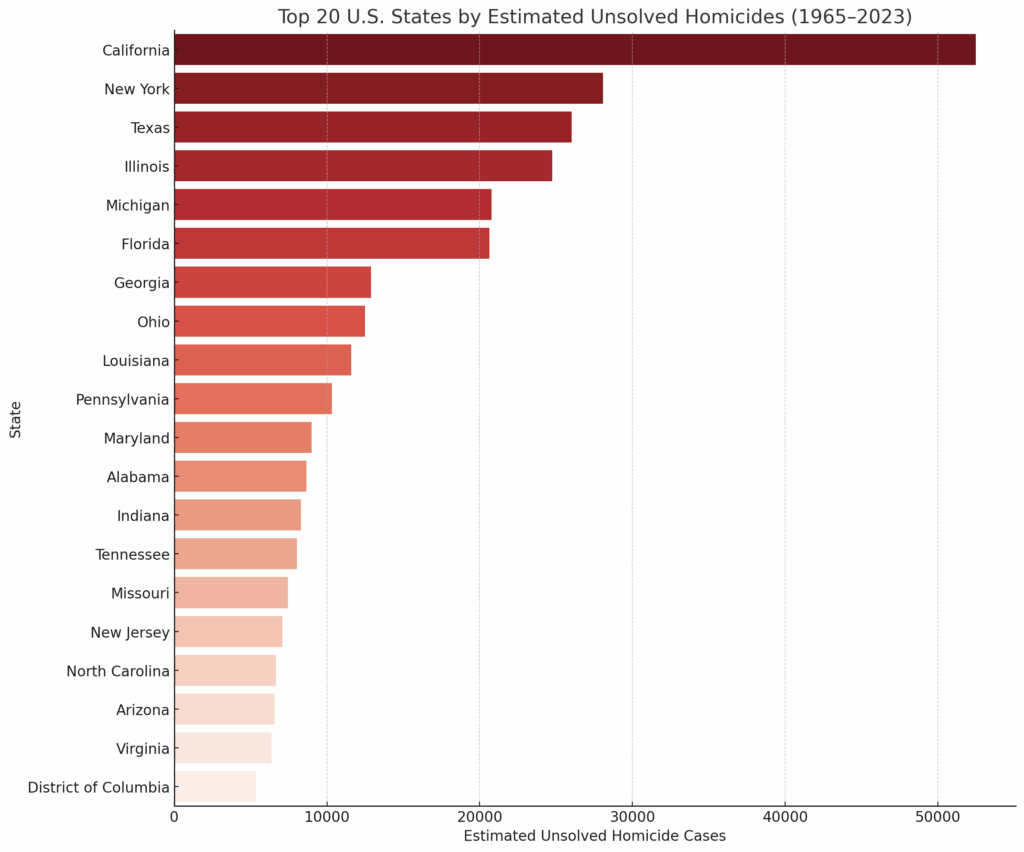
Here’s a bar chart showing the 20 U.S. states with the highest number of estimated unsolved homicide cases from 1965 to 2023. States like California, Illinois, and Michigan stand out as having particularly high numbers, which could be factors to consider in your relocation decision.
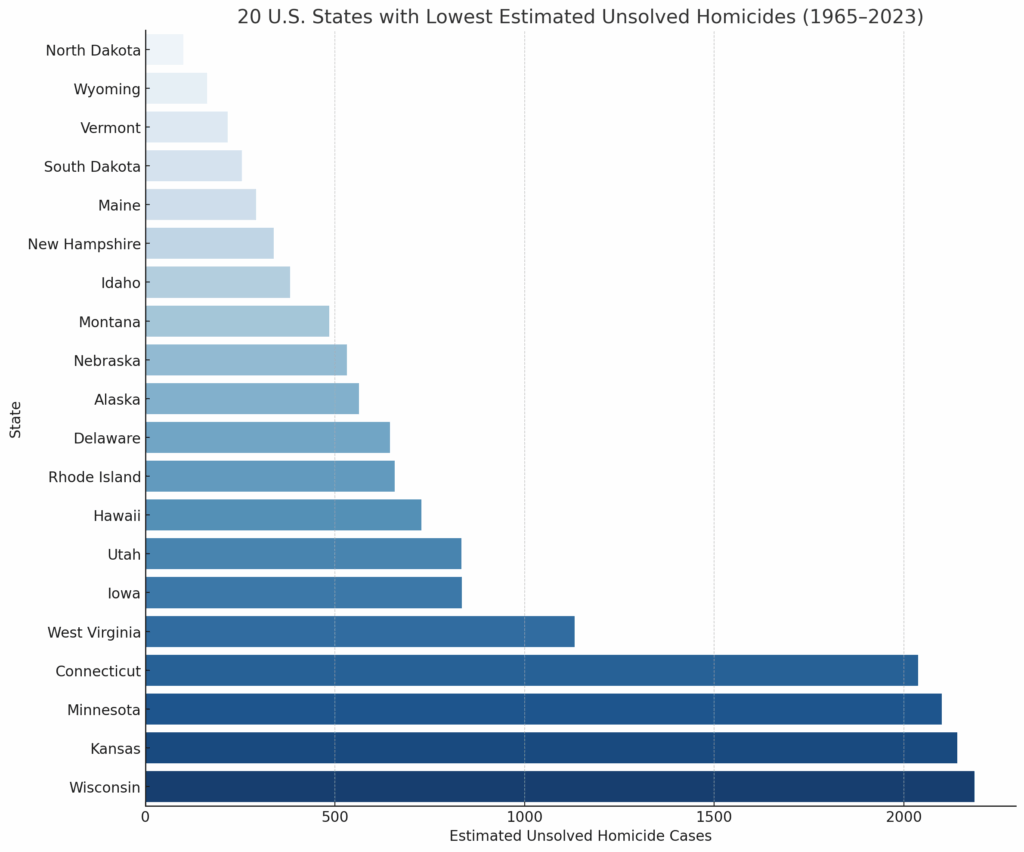
Here’s a bar chart highlighting the 20 U.S. states with the lowest estimated number of unsolved homicides. States like North Dakota, Wyoming, Vermont, and Maine appear among the safest in terms of cold case volume.